GONG Imagery Viewer
Tool for viewing imagery from the GONG network of solar telescopes
<Usage info TBD>
<Impacts info TBD>
<Details info TBD>
<History info TBD>
<Data info TBD>
<Usage info TBD>
<Impacts info TBD>
<Details info TBD>
<History info TBD>
<Data info TBD>
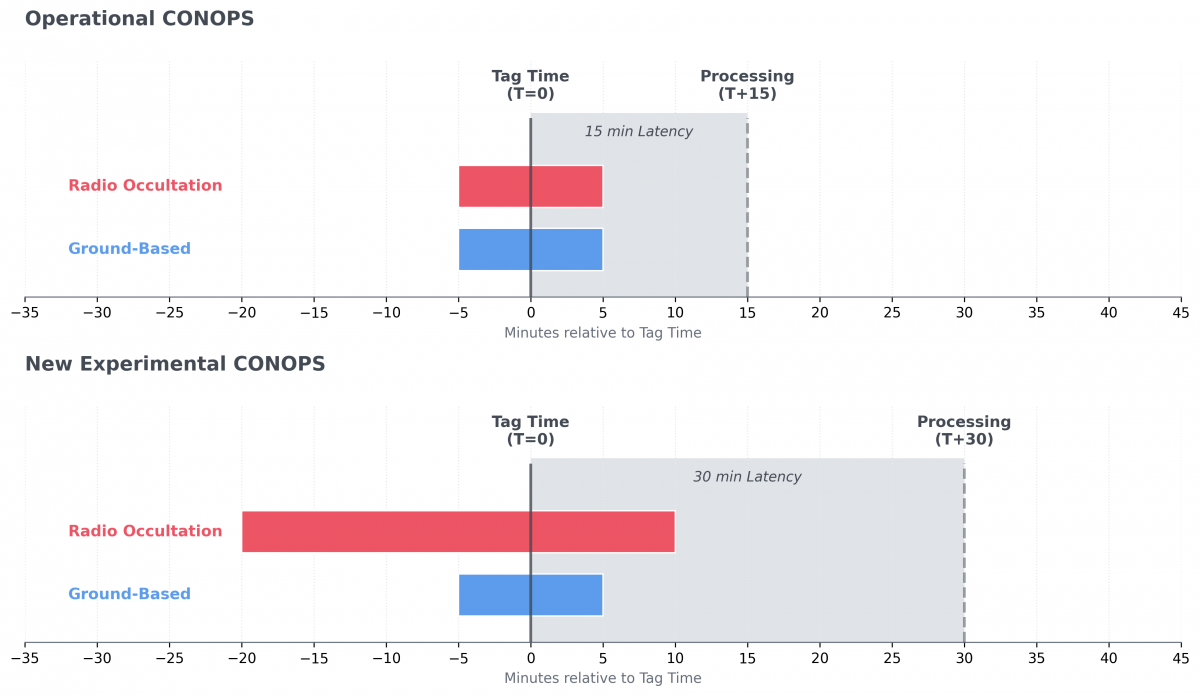
The current operational GloTEC CONOPS uses a 10-minute cadence, 15-minute latency, and a 10-minute observation window for both ground-based and RO observations, centered on the analysis tag time. The current operational CONOPS with 15-minute latency prevents the usage of most of the RO data due to the data latency. To improve model accuracy through ingesting more RO measurements, the new experimental CONOPS configuration shown on this page retains the 10-minute cadence but uses a 30-minute latency. Ground-based TEC is ingested over a 10-minute window, whereas RO data are ingested over an expanded 30-minute window extending from 20 minutes prior to 10 minutes after the analysis tag time. Two versions of the new experimental CONOPS are shown here. One version assimilates TEC data from ground-based receivers and COSMIC-2 radio occultation TEC data (left column). The other version uses the same ground-based and COSMIC-2 data, and adds the real-time PlanetiQ radio occultation TEC data acquired through NOAA’s Commercial Data Program (right column). The PlanetiQ RO data comes from the satellites GNOMES-4 and GNOMES-5. Both satellites are in sun-synchronous orbit. GNOMES-4 orbits at 10LT and 22LT. GNOMES-5 orbits at 11LT and 23 LT. PlanetiQ data provides polar coverage in these specific local time sectors.
Contact tzu-wei.fang@noaa.gov with questions or feedback
<Usage info TBD>
<Impacts info TBD>
<Details info TBD>
<History info TBD>
<Data info TBD>
<Usage info TBD>
<Impacts info TBD>
<Details info TBD>
<History info TBD>
<Data info TBD>
The observed and predicted Solar Cycle is depicted in Sunspot Number in the top graph and F10.7cm Radio Flux in the bottom graph.
In both plots, the black line represents the monthly averaged data and the purple line represents a 13-month weighted, smoothed version of the monthly averaged data. The slider bars below each plot provide the ability to display the sunspot data back to solar cycle 1 and F10.7 data back to 2004.
The predicted progression for the current solar cycle (Cycle 25) is given by the magenta line, with associated uncertainties shown by the shaded regions. This prediction is based on a nonlinear curve fit to the observed monthly values for the sunspot number and F10.7 Radio Flux and is updated every month as more observations become available. The shaded regions show the uncertainty in the prediction, obtained by applying the same prediction method to previous cycles at the same stage in each cycle. In particular, the three shades show the first three quartiles (25, 50, and 75%) of the deviations from previous predictions.
This should be interpreted as follows. There is roughly a 25% chance that the smoothed sunspot number will fall within the darkest shaded region at a particular time in the future. Similarly, there is a 50% chance the smoothed sunspot number will fall in the medium-shaded region and a 75% chance it will fall in the lightest of the shaded regions.
These plots, like many on the SWPC website, are interactive.
Note that both the updated prediction and the 2019 NOAA/NASA/ISES Panel prediction apply only to Solar Cycle 25. Solar Cycle 26 is expected to begin some time between January 2029 and December 2032. We do not yet produce a prediction for Solar Cycle 26.
Solar cycle predictions are used by various agencies and many industry groups. The solar cycle is important for determining the lifetime of satellites in low-Earth orbit, as the drag on the satellites correlates with the solar cycle, especially as represented by F10.7cm. A higher solar maximum decreases satellite life and a lower solar maximum extends satellite life. Also, the prediction gives a rough idea of the frequency of space weather storms of all types, from radio blackouts to geomagnetic storms to radiation storms, so is used by many industries to gauge the expected impact of space weather in the coming years.
The solar cycle prediction shown here is based fitting the observed data to a nonlinear function that reflects the average shape of solar cycles and that takes into account the observed tendency for stronger cycles to rise faster than weaker cycles. Different curves are used to fit the International Sunspot Number and the F10.7 radio flux. Uncertainties are based on applying the same prediction method to previous Solar Cycles, at the same point in each cycle, and then calculating the difference between the predicted and the observed smoothed monthly values. For further technical details, please consult the validation document.
The 2019 Panel prediction comes from an international Panel that was convened in 2019 by NOAA, NASA and the International Space Environmental Services (ISES) for the express purpose of predicting Solar Cycle 25. After an open solicitation, the Panel received nearly 50 distinct forecasts for Solar Cycle 25 from the scientific community. Prediction methods include a variety of physical models, precursor methods, statistical inference, machine learning, and other techniques. The prediction released by the panel is a synthesis of these community contributions. The Prediction Panel predicted Cycle 25 to reach a maximum of 115 occurring in July, 2025. The error bars on this prediction mean the panel expects the cycle maximum could be between 105-125 with the peak occurring between November 2024 and March 2026. The updated prediction can be considered as a recalibration of the 2019 Panel prediction based on new observational data.
The original version of the Solar Cycle 25 prediction, released in 2019, only showed the baseline NOAA/NASA/ISES Panel prediction. In February 2023, the Sunspot Number and F10.7 radio flux plots were modified to show the full range of the 2019 Panel prediction, taking into account expected uncertainties in the cycle start time and amplitude.
In October 2023 the updated prediction for Solar Cycle 25 was made available to the public as an experimental product on the Space Weather Prediction Testbed. After a period of feedback from SWPC customers and the general public, the updated prediction was made available on this web site in February 2025, replacing the 2019 Panel prediction. However, the Panel prediction can still optionally be displayed using the drop down menus.
This redesigned Testbed website is being developed to replace the Production Testbed
The GOES Solar Ultraviolet Imager (SUVI) Flare Location Product reports the latest solar flare location for SUVI’s “flaring” spectral channels (94Å and 131Å) in Heliographic Stonyhurst coordinates.
Do you have feedback about this product? Provide it here.
The GOES Solar Ultraviolet Imager (SUVI) is NOAA's operational solar extreme-ultraviolet (EUV) imager. This telescope allows forecasters to monitor the Sun’s hot outer atmosphere, or corona. Observations of solar EUV emission aids in the early detection of solar flares, coronal mass ejections (CMEs), and other phenomena that impact the geospace environment.
The real time SUVI flare location product reports flare locations for the SUVI “flaring” spectral channels (94Å and 131Å) with a 4 minute cadence. Graphical products show flare locations in the Heliographic Stonyhurst coordinate system for the most recent flare location. The SUVI Flare Location JSON data service also includes the flare location in R-theta, and pixel coordinate systems.
The SUVI Flare Locations are determined from the SUVI Thematic Map and, for each distinct flaring region, the algorithm returns the intensity-weighted centroid that indicates the location of each flare. Locations when the GOES X-ray Sensor (XRS) Event Detection algorithm determines that a solar flare is in progress.
For further details, see the following links:
NOAA NCEI archive of GOES Products and additional documentation
Example Jupyter Notebooks to Plot SUVI Flare Locations
Journal Article on Thematic Map Approach
The GOES Energetic Heavy Ion Sensor (EHIS) measures heavy ion flux values in geostationary orbit. The differential flux values are produced for the Hydrogen (H), Helium (He), Carbon-Nitrogen-Oxygen (CNO), Neon-Sulfur (Ne-S), and Chlorine-Nickel (Cl-Ni) mass groups, and for individual elements between Beryllium and Copper (Be-Cu).
Data files are provided for EHIS Level 1b (L1b) number fluxes and Level 2 linear-energy-transfer (LET) spectra of differential and integral number fluxes for the nine most abundant species above hydrogen (He, C, N, O, Ne, Mg, Al, Si, and Fe). Data files are available with a 5-minute cadence, for the last 24 hours.
Do you have feedback about this product? Provide it here.
The GOES 16-19 heavy ion fluxes are measured by an Energetic Heavy Ion Sensor (EHIS) on each satellite. EHIS looks radially outward, thus midway between the look directions (eastward and westward) of the two Solar and Galactic Proton Sensors (SGPS) on each satellite. SGPS is the primary GOES 16-19 source for solar energetic proton and alpha particle (helium-4 nucleus) fluxes.
EHIS Level 1b (L1b)
The EHIS Level 1b (L1b) product contains energy spectra of differential number fluxes (particles/cm2-sr-s-(MeV/nucleon)) of hydrogen, helium and heavy ion (carbon through copper) nuclei, consisting of five energy bands.
Data files also include data quality information that provides an assessment of the differential flux values, including whether they are invalid, and an indication of good or degraded quality. The rationale for the quality assessment is also given.
For each mass group, heavy ion flux is reported in five energy bands for one angular zone. Similarly, for each element in the elemental group, heavy ion flux is reported in five energy bands for one angular zone. The five energy bands are evenly spaced logarithmically spanning from 10 to 200 MeV per nucleon for the H and He mass groups. For all the mass groups and the elemental group, the energy band bounds are dynamic and included in the product. They are the weighted averages of the Prime and Non-Prime band energies. The Non-Prime and Prime states correspond respectively to when the external scintillator is included and is not included in the logic. Owing to MeV radiation belt electrons in GEO, the scintillator count rates are nearly always high, driving the EHIS units into the Prime state. The energy bands vary by atomic number (Z).
The one angular zone has a central look-angle that is anti-earthward and has a 60 degree conical field of view. The units of measure for the directional differential flux values are particles per second per square centimeter per steradian per (megaelectron volt per nucleon). The Level 1b product has a 5-minute cadence, corresponding to an accumulation of counts over a 5-minute period.
EHIS Level 2 (L2)
The EHIS Level 2 (L2) files contain linear-energy-transfer (LET) spectra of differential number fluxes (particles/cm2-sr-s-(MeV/mg-cm2)) and integral number fluxes (particles/cm2-sr-s) for the nine most abundant species above hydrogen (He, C, N, O, Ne, Mg, Al, Si, and Fe). These spectra are calculated under three thicknesses of Aluminum shielding (50, 100 and 500 mils). The input helium energy spectra are read from SGPS Level-2 5-minute averages because SGPS provides better energy resolution. Also, based on cross-calibrations performed by NCEI, the SGPS alpha particle number flux levels are closer to those reported by the predecessor GOES instruments (Energetic Particle Sensors on GOES-15 and prior satellites) and by instruments on ACE (SIS) and SOHO (ERNE).
EHIS is a small instrument compared to the ACE/Solar Isotope Spectrometer (SIS). (The SIS geometric factor is ~40 cm2 sr, while the largest EHIS geometric factor is 2 cm2 sr.) It is designed to measure the largest SEP events observed by GOES without saturation. The September 2017 and June 2024 SEP events demonstrated that EHIS could measure fluxes of the most abundant heavy ions (including iron) in the lowest-energy channel at 5-minute cadence during an S3 solar radiation storm. Fluxes are determined from a non-linear fit to a histogram of counts vs. an approximation to atomic number (ZCAL). The effective lower limits of the flux levels are summarized in Table 2 for the June 2024 SEP event.
Additional Documentation:
GOES R Series Product Definition and Users’ Guide (PUG) Volume 3: Level 1b Products, March 23, 2021, Revision 2.3 - see section 5.4.1 for Energetic Heavy Ions data format
GOES-R SEISS.20 Solar Energetic Particle Event Linear Energy Transfer Algorithm Theoretical Basis Document Version 1.2: