Development

Major Storm Geoelectric Simulations

Image
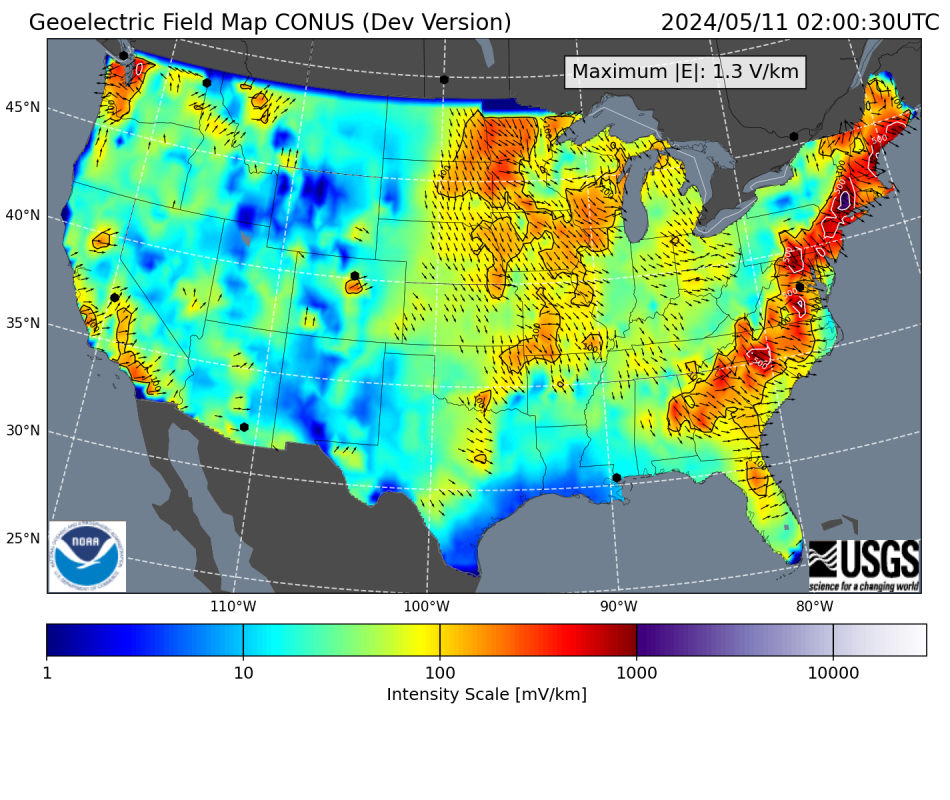
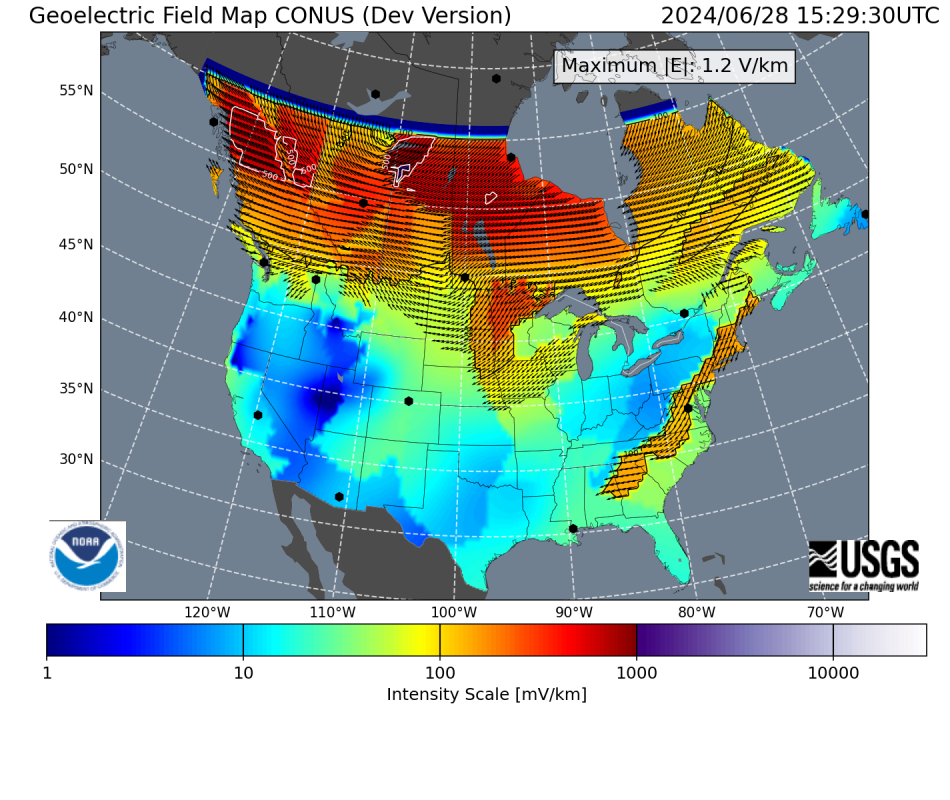
Geoelectric Field Map CONUS
Image
1D example


Description:

Non-exhaustive, science-quality, retrospective geoelectric simulations for geomagnetic major storm periods. These simulations were performed using the NOAA-USGS Geoelectric Models with ground magnetometer time series from INTERMAGNET. The number of stations included in any single simulation may vary, depending on quality and availability. Daily netCDF files contain gridded (0.5x0.5∘) geoelectric field components (Ex,Ey) at one-minute cadence. The list includes storms since 1991 (plus the March 1989 storm) that observed at least one synoptic period with a kp index above 8- (G4 or G5 in the NOAA scale) and it is organized by maximum Kp index in decreasing order.


Purpose:

This data repository is meant to provide end users with geoelectric field values during major geomagnetic storms for quantifying the effects of space weather on systems vulnerable to ground induced electric fields. Data in this repository are particularly aimed to facilitate Bulk Electric System (BES) planers in performing GeoMagnetic Disturbance (GMD) reliability analysis such as that recommended by the North American Electric Reliability Corporation (NERC) in their  TPL-007 guidelines.


Max Ap IndexMax Kp IndexStart DateEnd DateSECS input plots

Geoelectric Field Values

3D1D
Notes
3019o2024/05/102024/05/13Plots20240510
20240511
20240512
20240513
20240510
20240511
20240512
20240513
1. Known as: Gannon Storm, Mother's day storm.
2869o1989/03/131989/03/18Plots19890313
19890314
19890315
19890316
19890317
19890318
19890313
19890314
19890315
19890316
19890317
19890318
1. Known as: March '89 storm. 2. Cause of the 9-hour blackout in Quebec, Canada.
2529o2003/10/292003/11/01Plots20031029
20031030
20031031
20031101
20031029
20031030
20031031
20031101
1. Known as:Halloween Day storm.
1989-2024/10/102024/10/12Plots20241010
20241011
20241012
20241010
20241011
20241012
 
1949-1992/05/091992/05/12Plots19920509
19920510
19920511
19920512
19920509
19920510
19920511
19920512
 
1929o2000/07/142000/07/17Plots20000714
20000715
20000716
20000717
20000714
20000715
20000716
20000717
1. Known as: Bastille Day storm.
1929-2001/03/312001/04/02Plots20010331
20010401
20010402
20010331
20010401
20010402
 
1809-1991/11/081991/11/10Plots19911108
19911109
19911110
19911108
19911109
19911110
 
1499-1991/07/131991/07/15Plots19910713
19910714
19910715
19910713
19910714
19910715
 
1498-1991/06/091991/06/14Plots19910609
19910610
19910611
19910612
19910613
19910614
19910609
19910610
19910611
19910612
19910613
19910614
 
1429-2001/11/062001/11/07Plots20011106
20011107
20011106
20011107
 
1379-2000/04/062000/04/08Plots20000406
20000407
20000408
20000406
20000407
20000408
 
1348-1994/02/211994/02/23Plots19940221
19940222
19940223
19940221
19940222
19940223
 
1298o1991/07/081991/07/10Plots19910708
19910709
19910710
19910708
19910709
19910710
 
1298+2003/05/292003/05/31Plots2003052920030529 
1298-2000/08/112000/08/13Plots20000811
20000812
20000813
20000811
20000812
20000813
 
1278o2024/08/122024/08/13Plots20240812
20240813
20240812
20240813
 
1278+1998/09/251998/09/26Plots19980925
19980926
19980925
19980926
 
1268-2000/10/042000/10/06Plots20001004
20001005
20001006
20001004
20001005
20001006
 
1258+2023/04/232023/04/25Plots20230423
20230424
20230423
20230424
 
1248+2001/04/112001/04/13Plots20010411
20010412
20010413
20010411
20010412
20010413
 
1248+2017/09/072017/09/09Plots20170907
20170908
20170909
20170907
20170908
20170909
 
1209-1998/05/021998/05/06Plots19980502
19980503
19980504
19980505
19980506
19980502
19980503
19980504
19980505
19980506
 
1208+2006/12/142006/12/16Plots20061214
20061215
20061216
20061214
20061215
20061216
 
1178-2015/03/172015/03/19Plots20150317
20150318
20150319
20150317
20150318
20150319
1. Known as: St. Patrick's day storm.
1168-1993/04/041993/04/06Plots19930404
19930405
19930406
19930404
19930405
19930406
 
1148+1994/04/161994/04/18Plots19940416
19940417
19940418
19940416
19940417
19940418
 
1108+2015/06/222015/06/24Plots20150622
20150623
20150622
20150623
 
1098o2023/03/232023/03/25Plots20230323
20230324
20230323
20230324
 
1059-2005/08/242005/08/25Plots20050824
20050825
20050824
20050825
 
1058-2001/10/212001/10/23Plots20011021
20011022
20011023
20011021
20011022
20011023
 
1048+2001/11/242001/11/25Plots20011124
20011125
20011124
20011125
 
1038+2000/09/172000/09/19Plots20000917
20000918
20000919
20000917
20000918
20000919
 
102 2005/09/102005/09/14Plots20050910
20050911
20050912
20050913
20050914
20050910
20050911
20050912
20050913
20050914
 
1018o2000/05/242000/05/25Plots20000524
20000525
20000524
20000525
 
1008o1995/04/071995/04/09Plots19950407
19950408
19950409
19950407
19950408
19950409
 
988-2025/06/012025/06/04Plots20250601
20250602
20250603
20250604
20250601
20250602
20250603
20250604
 
968-1993/09/131993/09/14Plots19930913
19930914
19930913
19930914
 
958o1992/02/251992/02/28Plots19920225
19920226
19920227
19920228
19920225
19920226
19920227
19920228
 
958o1992/08/221992/08/24Plots19920822
19920823
19920824
19920822
19920823
19920824
 
948o1999/10/221999/10/24Plots19991022
19991023
19991024
19991022
19991023
19991024
 
948+2005/05/082005/05/09Plots20050508
20050509
20050508
20050509
 
938-2005/05/302005/05/31Plots20050530
20050531
20050530
20050531
 
928-1992/02/021992/02/04Plots19920202
19920203
19920204
19920202
19920203
19920204
 
878+2005/05/152005/05/17Plots20050515
20050516
20050517
20050515
20050516
20050517
 
858-1991/08/191991/08/23Plots19910819
19910820
19910821
19910822
19910823
19910819
19910820
19910821
19910822
19910823
 
858-2021/11/042021/11/05Plots20211104
20211105
20211104
20211105
 
848o2005/01/212005/01/23Plots20050121
20050122
20050123
20050121
20050122
20050123
 
818o2025/01/012025/01/02Plots20250101
20250102
20250101
20250102
 
788+2002/05/232002/05/24Plots20020523
20020524
20020523
20020524
 
758-1998/11/081998/11/10Plots19981108
19981109
19981110
19981108
19981109
19981110
 
748+2024/03/232024/03/25Plots20240323
20240324
20240325
20240323
20240324
20240325
 
708o1999/09/221999/09/23Plots19990922
19990923
19990922
19990923
 
708-2005/01/072005/01/09Plots20050107
20050108
20050109
20050107
20050108
20050109
 
658-2011/08/052011/08/07Plots20110805
20110806
20110807
20110805
20110806
20110807
 
628-1999/07/301999/07/31Plots19990730
19990731
19990730
19990731
 
618-2024/06/282024/06/29Plots20240628
20240629
20240628
20240629
 
588-2013/10/022013/10/03Plots20131002
20131003
20131002
20131003
 
428+2003/05/282003/05/29Plots20030528
20030529
20030528
20030529


Input Observations:

The nowcasting NOAA-USGS geoelectric models use real-time magnetometer data from USGS and NRCan stations, which sometimes can have artifacts, temporary outages, or incorrect baseline values, leading to inaccurate or nonexistent geoelectric field values. In order to eliminate these problems we employed geomagnetic time series from INTERMAGNET which typically re-process observatory data. In addition, the timeseries data were checked for missing values, spikes, and gaps, and the baselines were removed by subtracting the median value. In the table above, SECS input plots display the time series for visual inspection. The 24-hour period before the start of the storm is included in the plots since it is used to calculate the geoelectric field values according to the real-time method of Boteler & Pirjola (2022).


ASCII and geoJSON formats:

Text-format (ASCII or geojson) output files of the one-minute geoelectric field maps can be created using the following python-based script: netCDF to geoJSON ASCII
 

Download the netCDF file(s) to be converted into text files and process them according to the instructions in the link.


Notes:

  • The number of input geomagnetic stations included in the simulations can vary from storm to storm depending on availability or data issues such as large gaps.
  • Further simulations from other major storm periods will be added in future, based on input data availability and quality.


For details about the NOAA-USGS Geoelectric Model visit here.

For any comment, information, or to report any issues with the geoelectric data please email to jordan.guerra@noaa.gov. For any issues with this website please contact alicia.williams@noaa.gov.


Conditions of Use and Acknowledgements:

If any of this output is used for scientific publications, please include the following language (or similar) in the data availability statement: “Geoelectric fields values used in this work were calculated by the NOAA-USGS Geoelectric Field Model, which uses input data from USGS, NRCan, and magneto-telluric transfer functions from the EarthScope project. Data can be found here." For other purposes please include the following statement “Geoelectric data source: The NOAA-USGS Geoelectric Model” (or similar acknowledgment) and link to this page.

Page Type
Status

Solar Cycle Progression Update (Experimental Interactive Charts on VPC)

Updated solar cycle charts displaying new 2024 prediction for solar-cycle 25. Running in Highcharts

The observed and predicted ​Solar Cycle is depicted in Sunspot Number in the top graph and F10.7cm Radio Flux in the bottom graph.

In both plots, the black line represents the monthly averaged data and the purple line represents a 13-month weighted, smoothed version of the monthly averaged data. The slider bars below each plot provide the ability to display the sunspot data back to solar cycle 1 and F10.7 data back to 2004.

The predicted progression for the current solar cycle (Cycle 25) is given by the magenta line, with associated uncertainties shown by the shaded regions.  This prediction is based on a nonlinear curve fit to the observed monthly values for the sunspot number and F10.7 Radio Flux and is updated every month as more observations become available.  The shaded regions show the uncertainty in the prediction, obtained by applying the same prediction method to previous cycles at the same stage in each cycle.  In particular, the three shades show the first three quartiles (25, 50, and 75%) of the deviations from previous predictions.

This should be interpreted as follows.  There is roughly a 25% chance that the smoothed sunspot number will fall within the darkest shaded region at a particular time in the future.  Similarly, there is a 50% chance the smoothed sunspot number will fall in the medium-shaded region and a 75% chance it will fall in the lightest of the shaded regions.

These plots, like many on the SWPC website, are interactive.

  • Mousing your cursor over the plots will display the data values applicable to the date the cursor is over.
  • Left clicking on the data and holding while you drag will define a zoom window.
  • Use the buttons above each plot to return to the default zoom showing the current cycle or to show the entire available data set.
  • There is also an option to toggle the solar cycle numbering on/off.
  • Beneath each main plot window, the entire time series is shown and you can click/hold on either side of the blue shaded region to expand or contract the zoom window or if you click/hold on the blue shaded region itself, you can slide it to anywhere in the time series.
  • A drop down menu above and to the right of each plot allows you to PRINT, or download PNG, PDF, or SVG format images of the associated plot
  • Another drop down menu in the lower left to allows the user to plot the prediction made for Solar Cycle 25 by an international NOAA/NASA/ISES Panel in 2019, as well as the stated uncertainty in this prediction. 

Note that both the updated prediction and the 2019 NOAA/NASA/ISES Panel prediction apply only to Solar Cycle 25.  Solar Cycle 26 is expected to begin some time between January 2029 and December 2032.  We do not yet produce a prediction for Solar Cycle 26.  

Solar cycle predictions are used by various agencies and many industry groups. The solar cycle is important for determining the lifetime of satellites in low-Earth orbit, as the drag on the satellites correlates with the solar cycle, especially as represented by F10.7cm. A higher solar maximum decreases satellite life and a lower solar maximum extends satellite life. Also, the prediction gives a rough idea of the frequency of space weather storms of all types, from radio blackouts to geomagnetic storms to radiation storms, so is used by many industries to gauge the expected impact of space weather in the coming years.

The solar cycle prediction shown here is based fitting the observed data to a nonlinear function that reflects the average shape of solar cycles and that takes into account the observed tendency for stronger cycles to rise faster than weaker cycles.  Different curves are used to fit the International Sunspot Number and the F10.7 radio flux.    Uncertainties are based on applying the same prediction method to previous Solar Cycles, at the same point in each cycle, and then calculating the difference between the predicted and the observed smoothed monthly values.   For further technical details, please consult the validation document.

The 2019 Panel prediction comes from an international Panel that was convened in 2019 by NOAA, NASA and the International Space Environmental Services (ISES) for the express purpose of predicting Solar Cycle 25. After an open solicitation, the Panel received nearly 50 distinct forecasts for Solar Cycle 25 from the scientific community. Prediction methods include a variety of physical models, precursor methods, statistical inference, machine learning, and other techniques. The prediction released by the panel is a synthesis of these community contributions.  The Prediction Panel predicted Cycle 25 to reach a maximum of 115 occurring in July, 2025. The error bars on this prediction mean the panel expects the cycle maximum could be between 105-125 with the peak occurring between November 2024 and March 2026.  The updated prediction can be considered as a recalibration of the 2019 Panel prediction based on new observational data.

The original version of the Solar Cycle 25 prediction, released in 2019, only showed the baseline NOAA/NASA/ISES Panel prediction.   In February 2023, the Sunspot Number and F10.7 radio flux plots were modified to show the full range of the 2019 Panel prediction, taking into account expected uncertainties in the cycle start time and amplitude.

In October 2023 the updated prediction for Solar Cycle 25 was made available to the public as an experimental product on the Space Weather Prediction Testbed.  After a period of feedback from SWPC customers and the general public, the updated prediction was made available on this web site in  February 2025, replacing the 2019 Panel prediction.  However, the Panel prediction can still optionally be displayed using the drop down menus.