Products
The Testbed hosts products that are in various pre-operational stages of development. The overall transition process is described on the R2O2R Overview page. The product maturity stages can be mapped to the NOAA Readiness Levels (RLs). For instance, a product with an RL of 4-6 could be considered an 'alpha' test product. Alpha products are only accessible to those developers and stakeholders with logins to the website and appropriate permissions. Products with RLs 7-8 could be considered as 'beta' test products. In NWS terminology, these are dubbed 'experimental' products (see NWSI 10-102). SWPT and SWPC are seeking feedback for these public experimental products in preparation for formal deployment to operations. And an operational product is deemed Readiness Level 9 - it is supported 24/7 and has been fully validated for use as decision support information for users. Note that preoperational products should not be relied upon for operations.
Disclaimer: Products contained on this site are experimental and should not be relied on for operations.
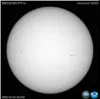
GONG Imagery Viewer
Tool for viewing imagery from the GONG network of solar telescopes
CCOR1-DIFF Coronagraph
Imagery from the Compact Coronagraph (CCOR) instruments will be used by the SWPC Forecast Office to characterize activity in the outermost part of the Sun’s atmosphere known as the corona
CCOR-2 Coronagraph
Imagery from the Compact Coronagraph (CCOR) instruments will be used by the SWPC Forecast Office to characterize activity in the outermost part of the Sun’s atmosphere known as the corona
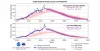
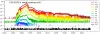
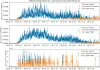
Solar Cycle Progression Update (Experimental Interactive Charts on VPC)
Updated solar cycle charts displaying new 2024 prediction for solar-cycle 25. Running in Highcharts
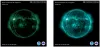
GOES SUVI Flare Location Product
GOES Solar Ultraviolet Imager (SUVI) Automated Flare Location Product
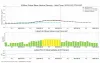
WAM-IPE Neutral Density (Experimental)
Global mean neutral density at 400 km calculated from the operational WAM-IPE model. Results from NRLMSISE-00 using the observed Kp are also included
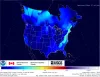
US-Canada-1D Geoelectric Field 1-minute (Experimental)
The geoelectric field is a measure of the induction hazard to man-made conductors, such as electrical power lines, that results from geomagnetic activity, and can be used to estimate the amount of current induced by integrating along the conducting pathway
Solar Cycle Progression
Updated solar cycle charts displaying new 2024 prediction for solar-cycle 25. Running in Highcharts
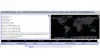
ICAO Space Weather Advisories Experimental Information
The ICAO Space Weather Advisories interface provides public access to advisories that may not otherwise be available to those outside of the aviation industry
GOES SGPS Alpha Particles
GOES Solar and Galactic Proton Sensors (SGPS) alpha particle measurements.
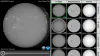
GONG Imagery
This product requires considerable data re-configuration, as it's original implementation on the Testbed does not align with the redesigned Testbed