Disclaimer: Products contained on this site are experimental and should not be relied on for operations.
Usage
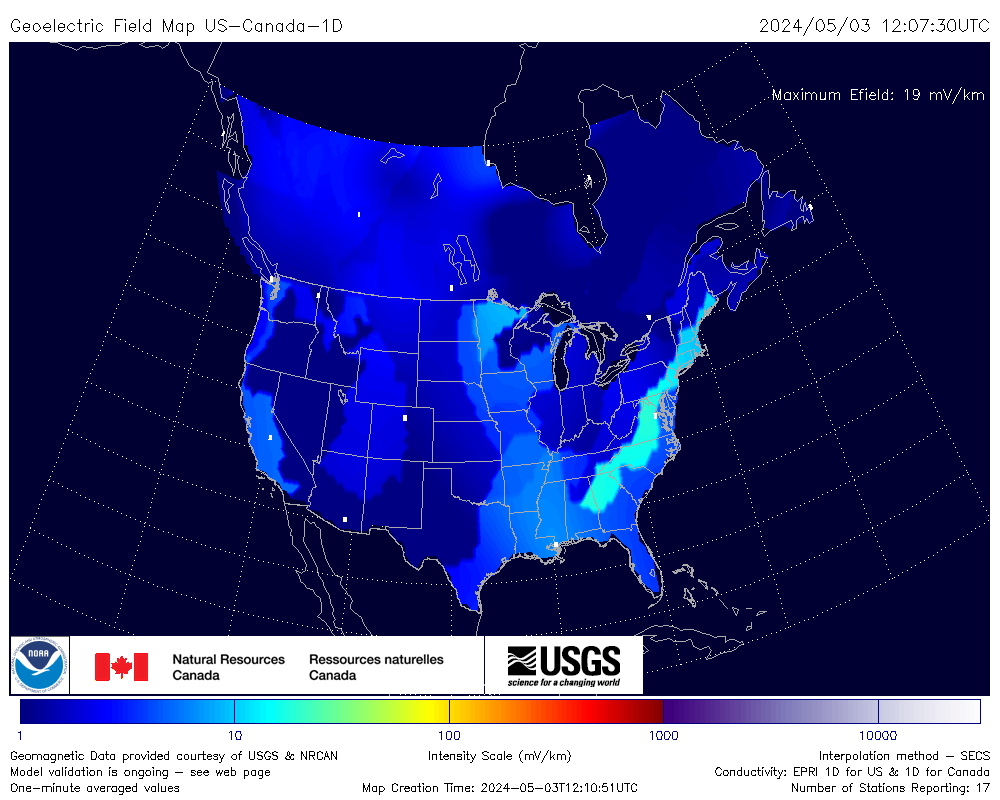
The geoelectric field is a measure of the induction hazard to man-made conductors, such as electrical power lines, that results from geomagnetic activity, and can be used to estimate the amount of current induced by integrating along the conducting pathway. The US-Canada-1D geoelectric field model uses 1D conductivity models over the lower 48 United States and over Canada up to 60 degrees latitude, with output spatial resolution of 1/2 degree in latitude and longitude. The official NWS product notification is available here and contains information on how to provide feedback during the 30 day comment period from April 4 - May 4.
Details
The near real-time US-Canada-1D E-field mapping project is a joint effort between NOAA/SWPC and NRCan/CHIS Space Weather, in collaboration with the USGS geomagnetism group and the NASA/CCMC.
Background
Potentially hazardous geoelectric fields can be induced during geomagnetic storms. These geomagnetic storms are a form of space weather driven by enhanced currents in Earth's magnetosphere and ionosphere and are observed at ground level as a time-varying magnetic field. As is well known from Faraday's law, a time-varying magnetic field induces currents along natural and artificial conducting pathways. This geoelectric field product combines information about the time-varying magnetic field together with Earth-conductivity information to estimate regional geoelectric fields. The amount of current induced in an artificial conductor may be calculated by integrating the geoelectric field along the conducting pathway. When currents are induced in artificial conductors, unexpected and sometimes problematic effects can occur in the operation of the affected equipment. Please see the article about the effect this has on electrical power systems at https://www.spaceweather.gov/impacts/electric-power-transmission. Please see also the article Modeling geomagnetically induced currents, by Boteler and Pirjola in Space Weather (31 January 2017), for an up-to-date description of this phenomena.
Versions and Caveats:
This version of the US-Canada electric field maps uses 1D physiographic conductivity models with the U.S. portion developed by the Electric Power Research Institute (EPRI – 2020) and the Canadian portion described by Trichtchenko et al. (2019). Users please note that there is also a 3D empirical version of the Geoelectric Field Maps (for the continental US only) running at SWPC (deployed to operations in FY2020); The 3D empirical model uses Magnetotelluric Transfer Functions (EMTF's) (see Kelbert et al., 2011 for details), which provide an Earth Conductivity description that incorporates the full 3D effects of Earth conductivity structures. The coverage area of the 3D empirical model is limited to locations where MT surveys have been published. In general we recommend that users located in the 3D empirical model coverage area use that model instead of the 1D model. The US-Canada-1D map, however, covers a larger area, using available information, and is being released experimentally to facilitate scientific research, validation, and familiarization for the operators.
The local geoelectric field is specified in millivolts per kilometer (mV/km) and is based on convolving a geomagnetic time-series signature with an Earth impulse response function, where the impulse response function depends on the local Earth conductivity (Boteler and Pirjola, 2022). In the US-Canada-1D version, geomagnetic time-series are interpolated onto a 0.5 degree by 0.5 degree grid using the method of Spherical Elementary Current Systems (SECS - see Amm & Viljanen, 1999; Pulkkinen et al. 2003 for more information about the method). The Earth conductivity is determined, based on the physiographic region that the grid point lies in and the associated, one-dimensional conductivity profile.
Users should note specifically that the Geoelectric Field Maps are in need of further validation against geoelectric field or geomagnetically induced current measurements. Recent research (e.g. Bedrosian & Love, 2015; Weigel, 2017; Bonner & Schultz, 2017; Kelbert et al., 2017), and initial comparisons with EMTF-based calculations suggest that in some regions, this approximation for the Earth's structure does not hold and the 1D geoelectric field estimation could be substantially inaccurate. We welcome collaborations from the user community to participate in the ongoing validation analysis that is needed. Retrospective E-field maps are available, or can be generated after the fact for the purposes of testing the geoelectric field models and systems models by comparison with system measurements.
At this time, we advise caution in the utilization of the Geoelectric Field Maps for operational mitigation of geomagnetic hazards without prior investment in a validation study. We hope, however, that the release of this product will facilitate additional research on geomagnetic hazards and validation activities within the power industry and will help operators have better situational awareness during geomagnetic storms.
Acknowledgements:
Key data provider agencies are gratefully acknowledged for their contributions:
- The U.S. magnetic observatories are operated and maintained by the U.S. Geological Survey
- The Canadian magnetic observatories are operated and maintained by Natural Resources Canada
- Updated 1D models for the U.S. were provided courtesy of the Electric Power Research Institute (EPRI Product ID 3002019425, June 08, 2020, Use of Magnetotelluric Measurement Data to Validate/Improve Existing Earth Conductivity Models)
The maps use a geomagnetic-field time series interpolation algorithm (Spherical Elementary Current Systems) developed and made available courtesy of the Finnish Meteorological Institute (Amm & Viljanen, 1999; Pulkkinen et al., 2003)
References:
Amm, O. & A. Viljanen (1999). Ionospheric disturbance magnetic field continuation from the ground to the ionosphere using spherical elementary current systems, Earth Planets Space, 51, 431-440.
Bedrosian, P.A., A Kelbert, B.L. Burton, J.R. Morris, and C. Blum (2015). Long Period Magnetotelluric Transfer Functions from the Florida Peninsula. doi:10.17611/DP/EMTF/USGS/GEOMAG/FL15
Bedrosian, P. A., & Love, J. J. (2015). Mapping geoelectric fields during magnetic storms: Synthetic analysis of empirical United States impedances. Geophysical Research Letters, 42(23).
Bonner, L. R., & Schultz, A. (2017). Rapid prediction of electric fields associated with geomagnetically induced currents in the presence of three‐dimensional ground structure: Projection of remote magnetic observatory data through magnetotelluric impedance tensors. Space Weather, 15(1), 204-227.
Boteler, D. & R. Pirjola (2017), Modeling geomagnetically induced currents, Space Weather, DOI10.1002/2016SW001499 (31 January 2017).
Boteler, D.H. and Pirjola, R.J. (2022), Electric Field Calculations for Real-Time Space Weather Alerting Systems, Geophys. J. Int., https://doi.org/10.1093/gji/ggac104
Kelbert, A., G.D. Egbert and A. Schultz (2011), IRIS DMC Data Services Products: EMTF, The Magnetotelluric Transfer Functions, https://doi.org/10.17611/DP/EMTF.1
Kelbert, A., Balch, C. C., Pulkkinen, A., Egbert, G. D., Love, J. J., Rigler, E. J., & Fujii, I. (2017). Methodology for time‐domain estimation of storm‐time geoelectric fields using the 3D magnetotelluric response tensors. Space Weather.
Meqbel, N. M., Egbert, G. D., Wannamaker, P. E., Kelbert, A., & Schultz, A. (2014). Deep electrical resistivity structure of the northwestern US derived from 3-D inversion of USArray magnetotelluric data. Earth and Planetary Science Letters, 402, 290-304.
Murphy, B. S., & Egbert, G. D. (2017). Electrical conductivity structure of southeastern North America: Implications for lithospheric architecture and Appalachian topographic rejuvenation. Earth and Planetary Science Letters, 462, 66-75.
Pulkkinen, A., O. Amm, A. Viljanen, et al. (2003). Separation of the geomagnetic variation field on the ground into external and internal parts using the spherical elementary current system method, Earth Planets Space, 55, 117-129.
Sun, J., Kelbert, A., & Egbert, G. D. (2015). Ionospheric current source modeling and global geomagnetic induction using ground geomagnetic observatory data. Journal of Geophysical Research: Solid Earth, 120(10), 6771-6796.
Trichtchenko, L., Fernberg, P.A., Boteler, D. (2019). One-dimensional Layered Earth Models of Canada for GIC Applications, Geological Survey of Canada Open Files 8594 & 8595.
Weigel, R. S. (2017). A comparison of methods for estimating the geoelectric field. Space Weather, 15(2), 430-440.
Yang, B., Egbert, G. D., Kelbert, A., & Meqbel, N. M. (2015). Three-dimensional electrical resistivity of the north-central USA from EarthScope long period magnetotelluric data. Earth and Planetary Science Letters, 422, 87-93.
History
Local specification of the Geoelectric Field was identified by users in the electrical power industry as a critical need at SWPC's space weather workshop in 2011. Since then, through collaboration between SWPC, USGS, NASA/CCMC, and NRCAN, efforts have been devoted to meeting this important need. This parameter has also been identified as the key measure by the North American Electric Reliability Corporation in terms of Geomagnetic Disturbance mitigation. In particular, a benchmark Geomagnetic Disturbance Event has been defined and is being refined in terms of Geoelectric Field time series in order for the industry to carry out vulnerability assessments and mitigation measures. The quantity was also highlighted by the National Space Weather Action Plan from the Office of Science and Technology Policy of the President in the initial draft (October 2015) and through later versions of the plan.
Initial experimental release of the 1D Geoelectric Field Maps (graphics) occurred in October 2017 and full deployment to SWPC operational systems occurred on September 17, 2019. Data values are available on request.
The upgrade using EMTF-based conductivities became experimental in June 2020 and went operational in September 2020.
An update to the EMTF-based E-field product was accomplished in March 2022, based on the addition of new surveys published at the IRIS-EMTF web page. The primary change is increased coverage in the southwestern part of the continental United States.
On June 15, 2023, the joint US-Canada 1D model was deployed to operations, replacing the original Fernberg 1D model. In addition the 3D empirical model was updated to incorporate recent survey results from the IRIS database that were publicly available as of December 2022, further increasing the model coverage over CONUS.
Archive
Recent quantitative results for the US-Canada 1D model can be found in geojson format here:
https://services.swpc.noaa.gov/json/lists/rgeojson/US-Canada-1D/
Recent quantitative results for the empirical EMTF model in geojson format can be found here:
https://services.swpc.noaa.gov/json/lists/rgeojson/InterMagEarthScope/
Recent daily netcdf files for the SECS magnetic field interpolation model can be found here:
https://services.swpc.noaa.gov/experimental/netcdf/geomagnetic/secsmaps/
Archive maps and data for the US-Canada 1D and the EMTF empirical 3D Geoelectric Field Maps are available by request.